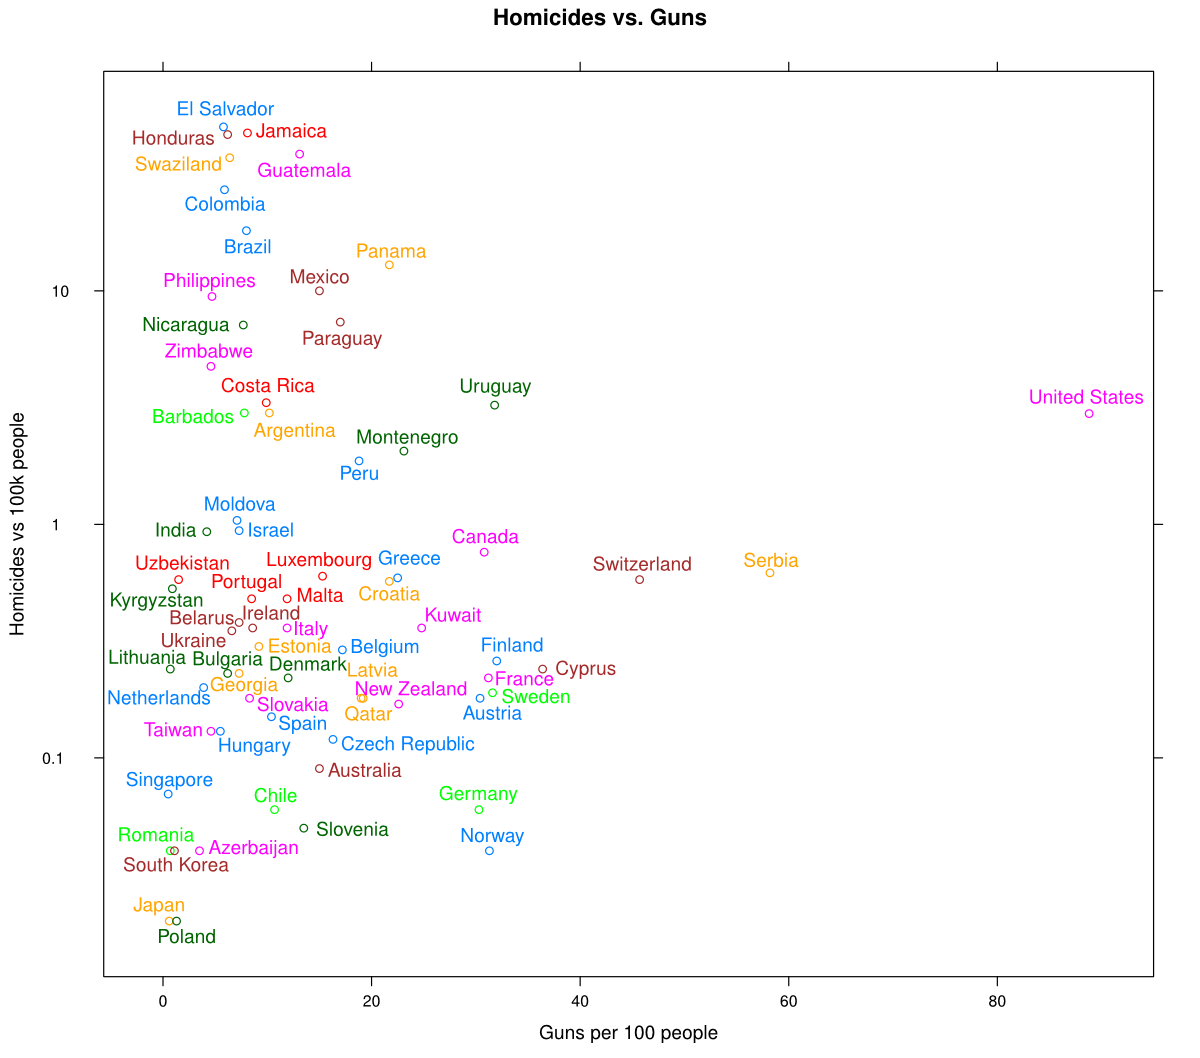
Inspired by Mark Reid’s post illustrating the bimodal relationship between the density of guns in a population and the number of gun homicides, I’ve created a slightly different plot from the same data, designed to illustrate a slightly… muddier relationship. This is an expanded variant of homicides vs guns, all countries, but scaling firearm homicides by log(10) shows the relationships between low-homicide countries.

library(directlabels)
library(lattice)

guns <- read.table("guns/data/guns.csv", sep="\t", header=TRUE)
deaths <- read.table("guns/data/deaths.csv", sep="\t", header=TRUE)
oecd <- read.table("guns/data/oecd.csv", sep="\t", header=TRUE)

data <- merge(guns, deaths, by="Country")
data$OECD <- data$Country %in% oecd$Country

plot(
  direct.label(
    xyplot(Homicides ~ Guns, data,
           group=Country,
           main="Homicides vs. Guns",
           xlab="Guns per 100 people",
           ylab="Homicides vs 100k people",
           scales=list(y = list(log = 10))),
    "top.points"))
homicides.png

Awkward question #1: what the hell are we supposed to make of the United States? Awkward question #2: why are there two clusters with vague correlations in opposite directions? Awkward question #3: Where’s Africa? Well that one’s easy–we don’t have reliable crime statistics for many African nations. But still, what the hell is going on here?

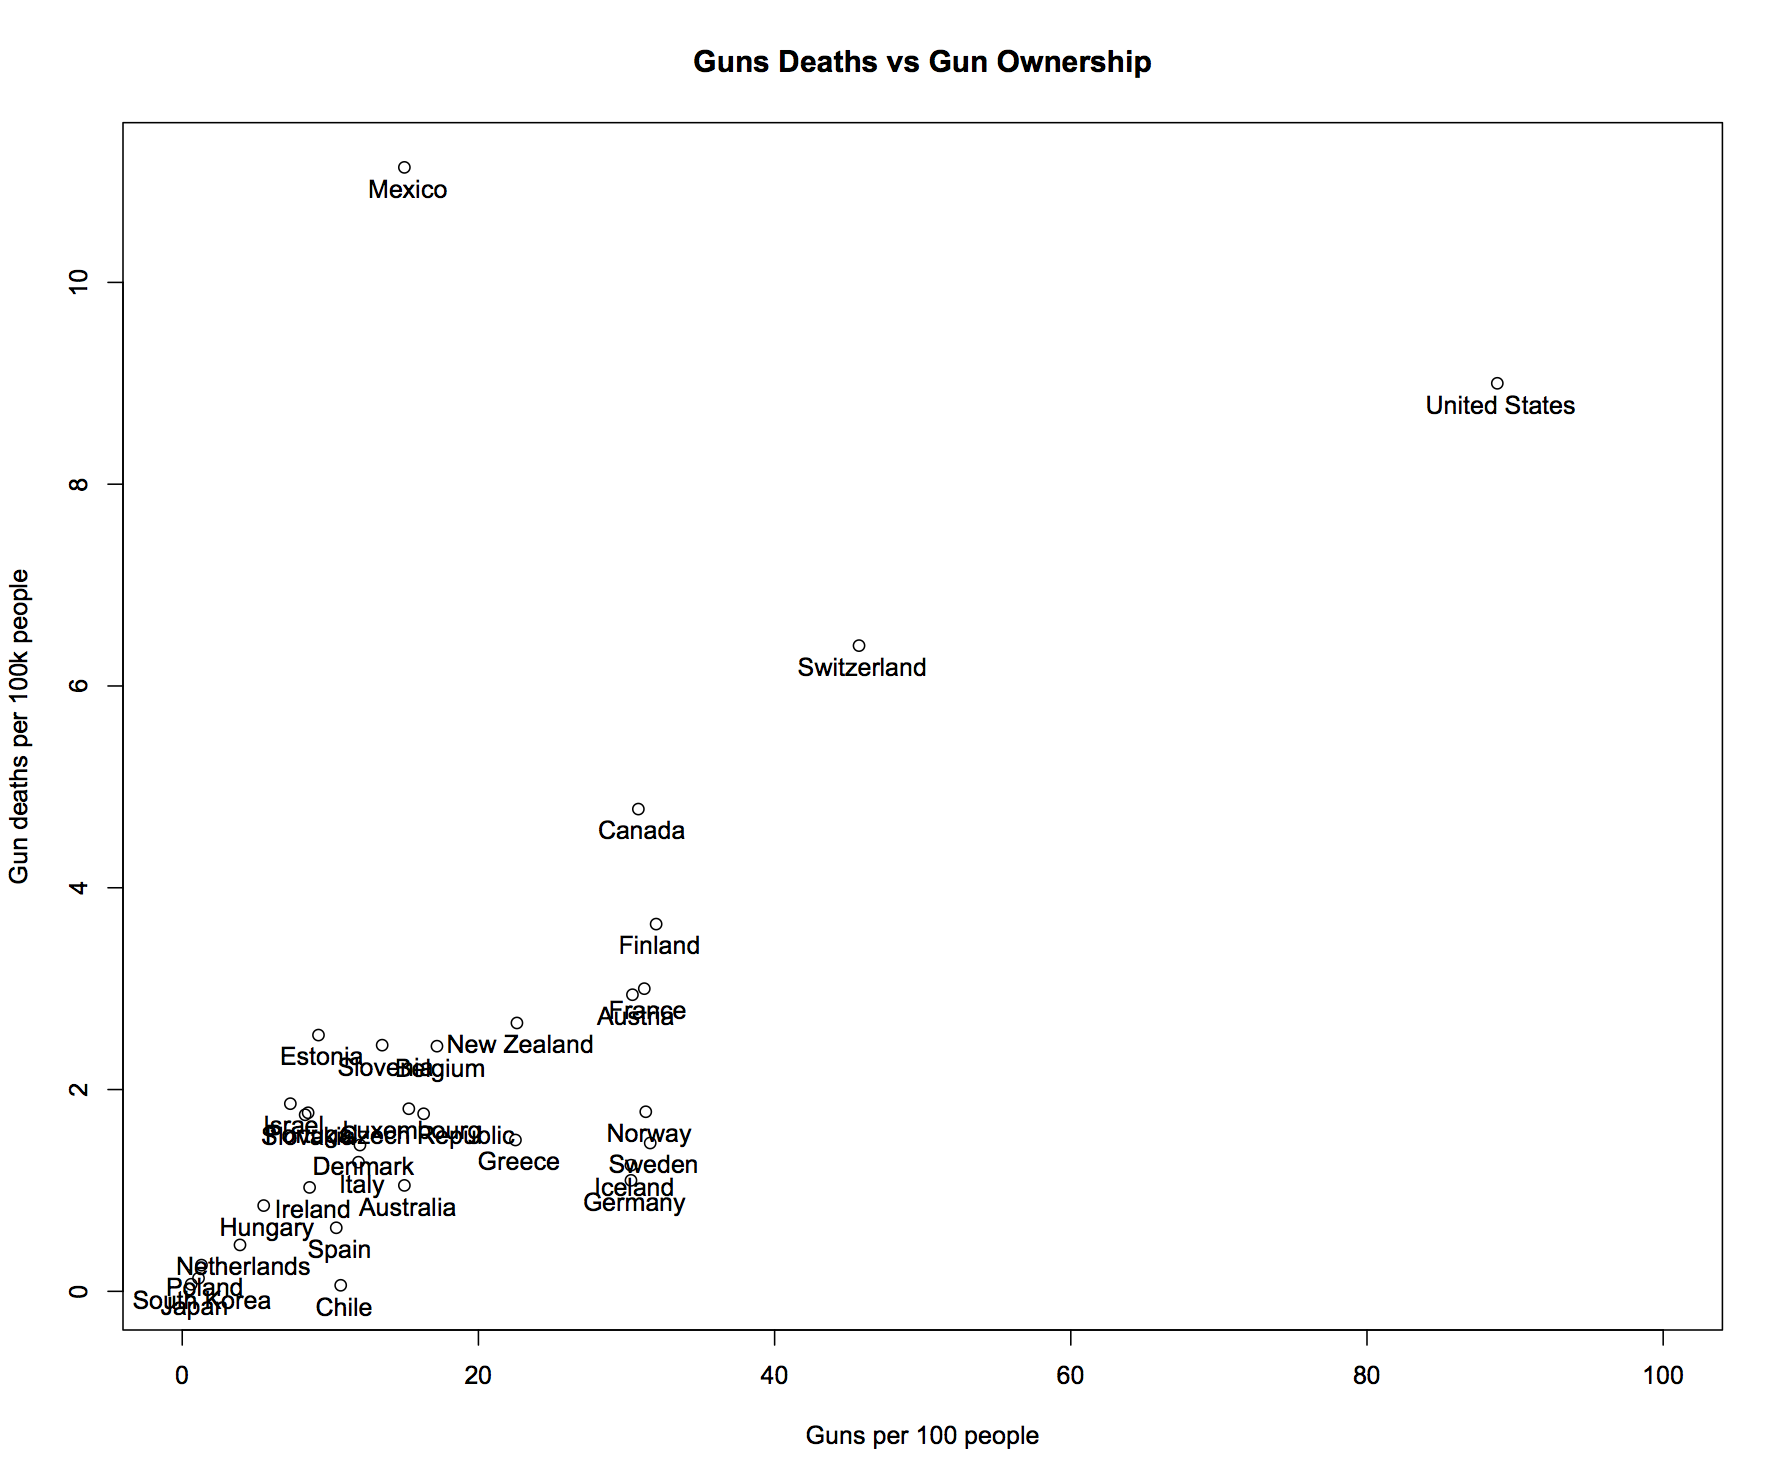
I think we’ve got a tendency to get excited about the linearity in graphs like this:
deaths-vs-guns.png

… when most of that linearity is actually an effect of gun suicide. Panel analysis of Australia’s National Firearms Agreement–probably the largest and most consistently executed gun buyback we have data for–suggests that reducing the prevalence of firearms (primarily long guns; handguns were already tightly regulated) dramatically reduced firearm suicides in Australia. This makes good sense; when guns are less available, fewer people who want to commit suicide will use them. But what about homicide? Would reducing the prevalence of guns help us prevent killings?

Unfortunately the NFA evidence is, well, weak. There is a statistically significant effect in the panel x timeseries data suggesting the buyback reduced firearm homicide–but the error bars on those figures are extremely large and include nonzero possibilities of negative deaths. I don’t find their post-hoc error adjustment particularly convincing, but I’m also not a professional statistician. At the end of the day, it comes down to sample size. Australia had less than 300 firearm homicides in five years! It’s quite difficult to find a statistically significant effect on a dataset that small.

It’s also tricky to identify how much of the reduction is due specifically to a change in gun dynamics after the buyback, since non-firearm homicides and non-firearm suicides also dropped dramatically following the NFA. Was the drop in crime primarily a consequence of, say, macroeconomic factors reducing the drive for violence? Or was it principally due to lower firearm prevalence? I’ve read quite a few papers trying to apply PCA or ANOVA to state or country-level data or perform timeseries analysis before and after legislation, and, well… most of the results around homicide seem mixed. There are a few policy interventions that seem to have significant positive effects, but in general this is a tough problem with many confounding variables. The NFA paper has a great background introduction to the problem, if you’re curious.

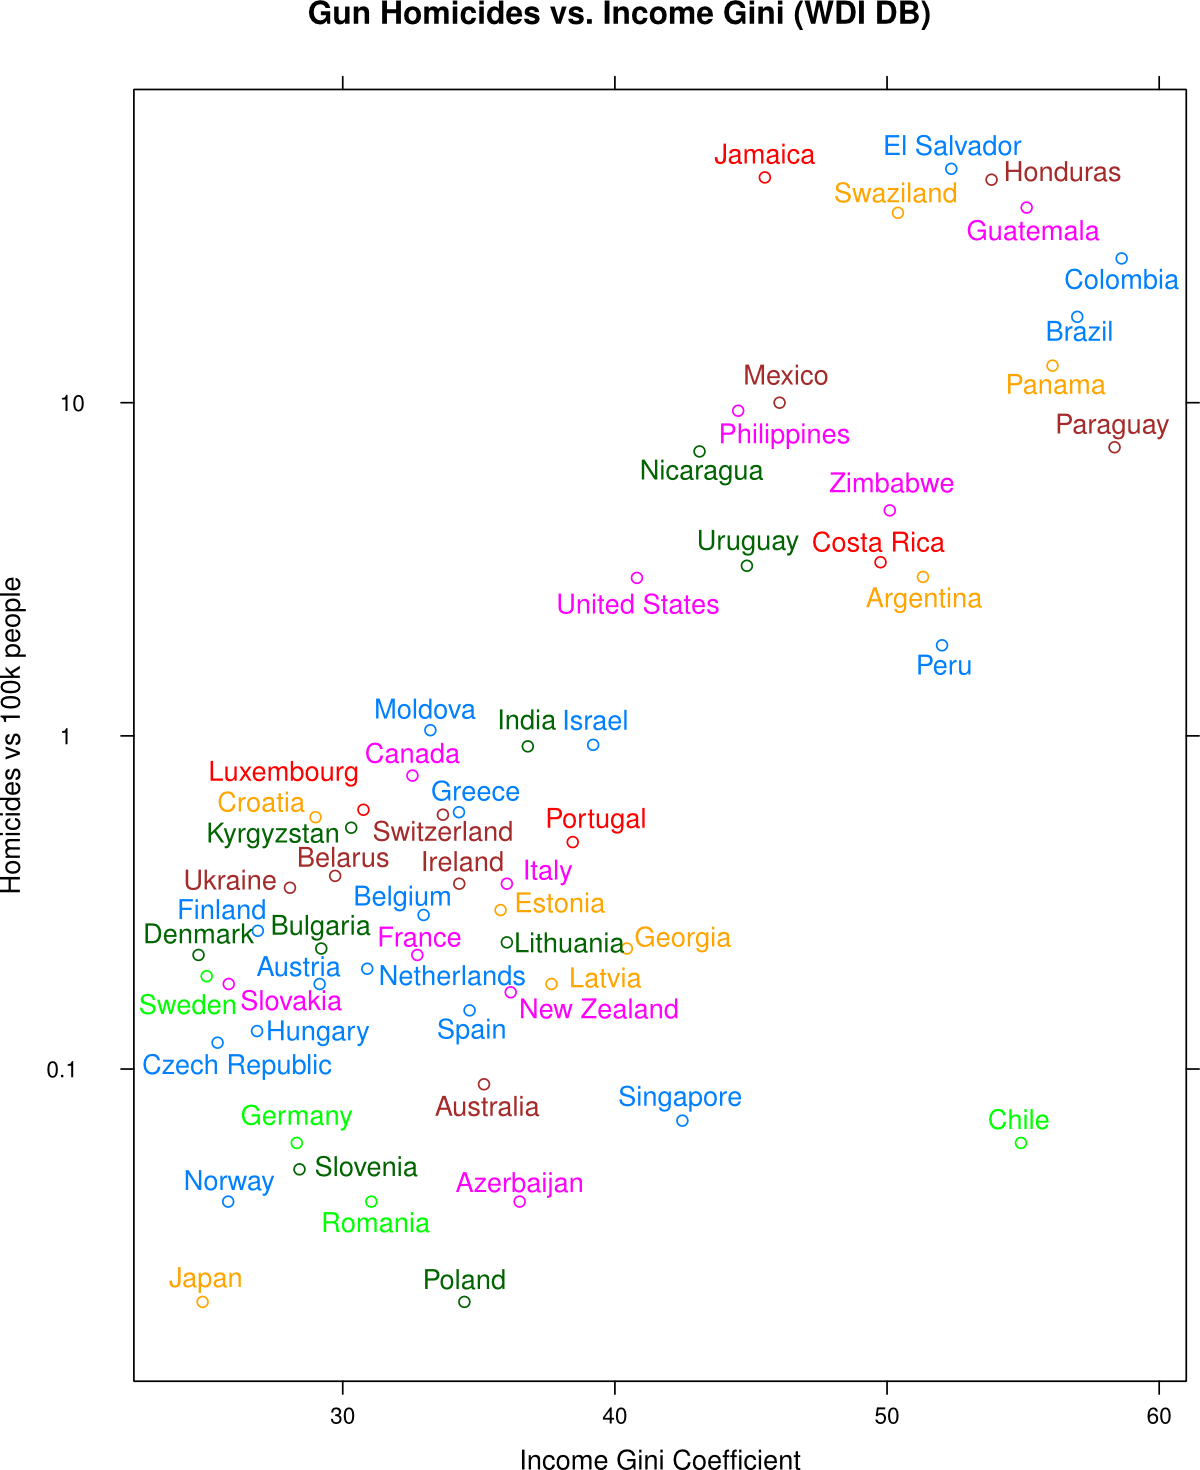
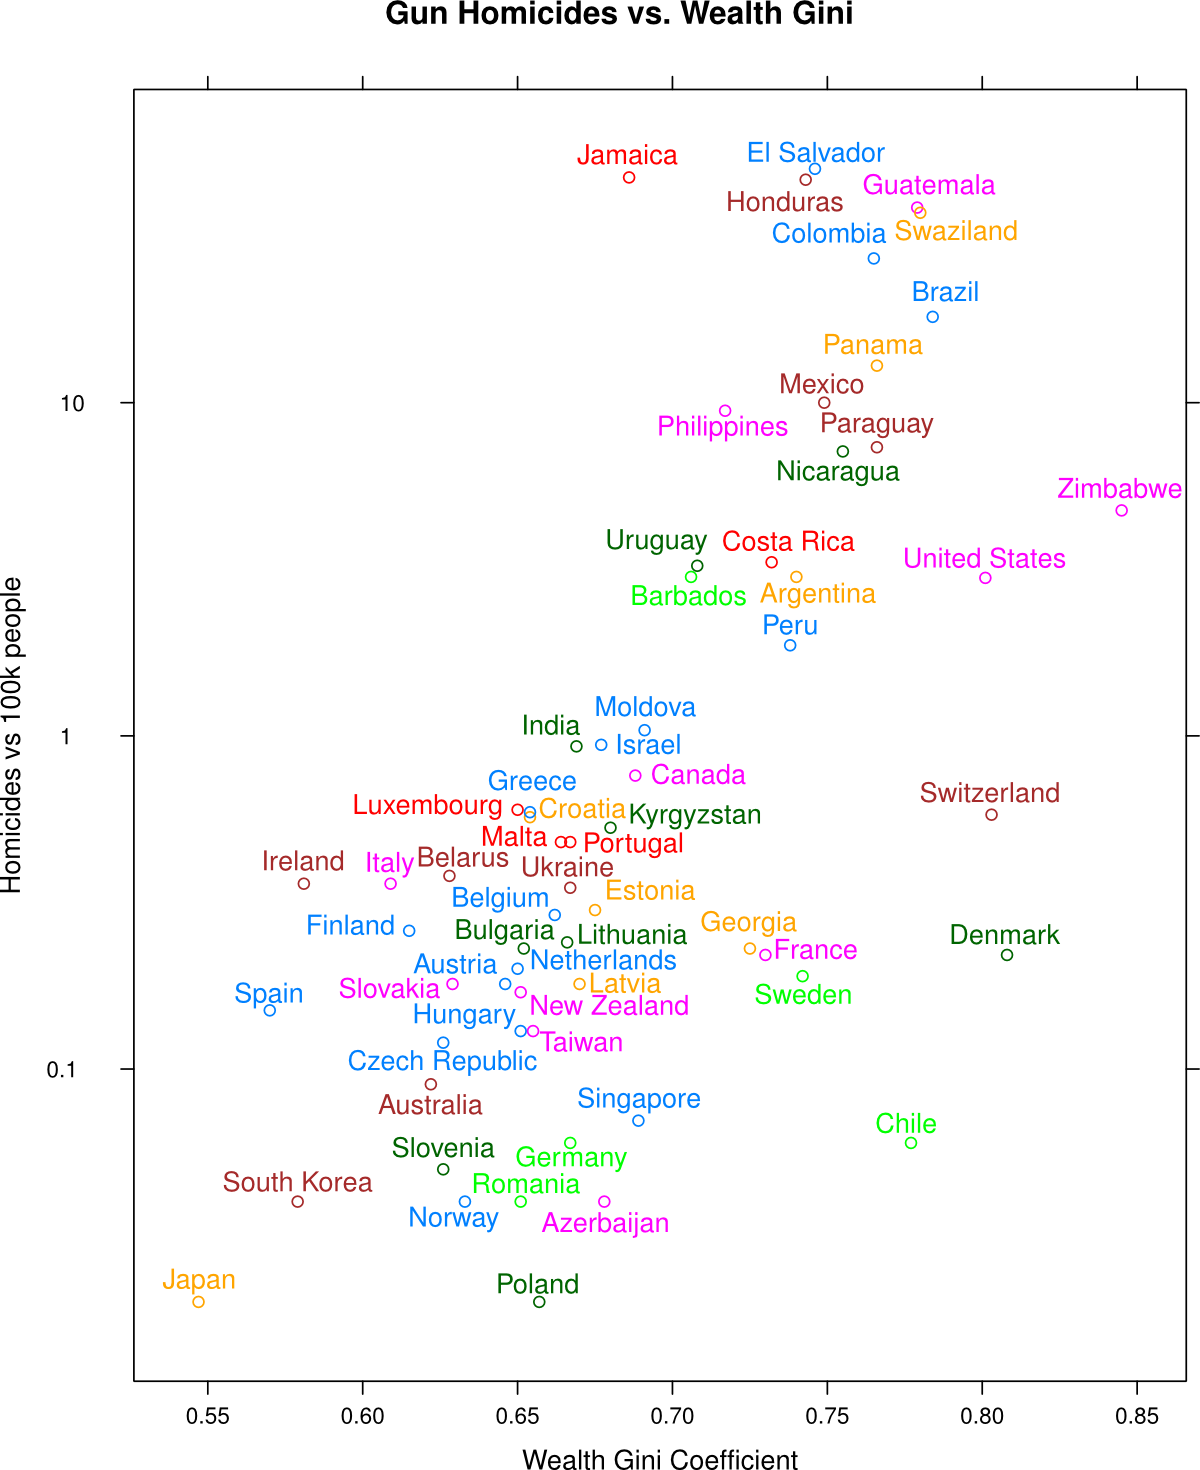
While you ponder that, and just why Latin American nations with low GDP per capita seem to suffer much higher rates of firearm homicides than social-democratic European nations with more guns per capita, consider that we have a better predictor of gun homicide than prevalence:
homicide-vs-income-gini.png

homicide-vs-wealth-gini.png

This is nothing new: we know economic inequality correlates strongly with all types of crime. There are plausible causal links both ways. Lack of access to basic goods causes some violent crime, and violence hinders the development of stable income channels for families and businesses by diverting or destroying human capital and property. Income inequality is negatively correlated with access to education, social services, progressive tax structures, social mobility, unionization, life expectancy, physical and mental health, social cohesion… there’s a complex web of relationships here, and I don’t have the statistical wherewithal (or datasets, for that matter) to give a more specific account.

What you can tell from these graphs is that prevalence isn’t the whole story. The lack of a strong global correlation between gun prevalence and homicides means it’s not just “lots of guns” causing violent crime. Why does Brazil show almost ten times more violence than Argentina, with comparable gun prevalence? Socioeconomic conditions play a role as well.

isomorphismes

A nice ante up from @mbusigin’s original. Maybe I will play too if I finish what I’m working on in time.

David MacIver

One confounding factor is that guns per capita isn’t a terribly good measure of prevalence because it over-counts. Gun owners will often have more than one gun, and the number of guns per gun owner is almost certainly strongly positively correlated with the wealth of the country, which is in turn negatively correlated with violent crime.

I couldn’t seem to find any decent stats for percentage of the population who own guns for different countries unfortunately.

Aphyr on

You’re right, David–there are several variables at play here. Obviously “Guns per capita” is a poor predictor of “deaths caused by a firearm”–the graph tells us that much. “Percentage of the population which owns guns” might be a better predictor, but since the fraction of the population which kill people with firearms is so small compared to the larger pool of gun owners, and criminals are less likely to report their gun use in surveys, that metric could have its difficulties too.

I should also be clear that this comparison tell us only about the relationship of gun prevalence in each country, not the policymaking question “How would the US behave if we changed the prevalence of guns?”

There’s a very simple and politically untenable solution to that question, which is simply to determine some observables like “amount of gun-related violence” and “amount of non-gun-related violence”, sign and implement a strict gun-control law–say, outlawing possession of handguns nationally–and watch what happens for five years. The more assertive the law is, the easier it’ll be to determine its effects.

Local bans won’t be sufficient: plenty of municipalities have imposed strict firearms ownership restrictions but without controlled borders these laws have little impact on firearm density. Surveys of felons who used firearms in an offense indicate cost is an important factor in weapon selection. A national buyback might raise the price of grey-market weapons used in crime, and cause substitution to other, less deadly weapons or crime.

This is certainly consistent with the NFA study, and perhaps with Britain’s firearms ban, but there’s a distinct lack of solid data. Since the US has so many guns, a unique mix of cultural factors, and is so large, I suspect controlled experiment could be the best way to determine the effects of policy measures.

Aphyr
RoMa
RoMa on

Here are some figures for Norway:

The National Weapons Registry shows that there are 31 registered firearms per 1'000 persons in Norway, where the total population is 5'038'100.

There’s a total of 1'233'510 firearms in the Weapons Registry (this number doesn’t include military firearms, or privately owned shotguns bought before 1990), owned by a total of 485'170 persons, 438'000 of which are registered as hunters. Out of the latter, less than 200'000 pay the mandatory annual fee for active hunters, which means that most weapons are not being used at all.

Between 1991–2010, out of a total of 723 murders, 171 (23,7%) were committed with firearms.

There are no estimates for the number of illegal firearms in Norway, but it is believed that the total number of guns is significantly higher than the Weapons Registry indicates.

Daniel Jordan
Daniel Jordan on

I’m curious about inequality as a predictor. GINI isn’t great. The folks at the Equality Trust in the UK might have an interesting approach to analyzing these data.

Jesse
Jesse on

This is a much better and more interesting analysis than the one that inspired it which really is just various ways of rehashing the large amount of guns in the US.

Jesse
Jesse on

Its also at least makes an attempt to analyze data and numbers more deeply than most large media/blogs opinion pieces which have some presumably smart people doing analysis at the level of cavemen (2 is greater than 3 without mentioning a standard deviation).

Although the gun count for countries probably has issues in itself ( I imagine countries with stricter gun-regulation dont have as accurate a count because they likely have a larger black market)

Chaddaï
Chaddaï on

This is really interesting and those two graphs are effectively much closer to a “simple” correlation… but I’m surprised by the fact that nobody remarks on the place of the US here : it appears to be in between developed countries and developing ones. For the superpower whose GDP per capita is among the highest, whose military is the strongest on earth, isn’t that a bit disquieting ? Not that I’m throwing the stone, my country isn’t so much better and has been sliding toward greater inequalities along the rest of the western world for several decades now but still, nobody is shocked by these graphs ?

jim

Sorry, you are way outa my league when it comes to stats, but I would love to see you take these same graphs and apply them to non-firearm crimes. Does rape and assault fall overall compared to gun ownership? How about burglary? Does homicide in general fall when there are less guns? It seems that the overall question we all would like answered is “do guns prevent or lower physical crime”? For instance, in the UK or Australia, where there are very strict gun control laws, am I more likely to be the victim of a crime there? I would really appreciate any kind of answer Regards, Jim

Aphyr on

“I’m curious about inequality as a predictor. GINI isn’t great. The folks at the Equality Trust in the UK might have an interesting approach to analyzing these data.”

Quite right. Both income and wealth distributions are measured differently in every country, and even if they were, the Laffer curve in both cases isn’t preserved by the Gini function. We should also note that hypothetical societies with completely even income distribution can show unequal wealth distribution due to savings. At best the Gini coefficient is only a rough approximation of relative access to capital, goods, and services. We could also be measuring a systematic bias: “countries with income reporting schemes which bias towards equality because of social or policy factors, also tend to have lower rates of gun crime,” that sort of thing.

Aphyr
Aphyr on

“…I’m surprised by the fact that nobody remarks on the place of the US here : it appears to be in between developed countries and developing ones. For the superpower whose GDP per capita is among the highest, whose military is the strongest on earth, isn’t that a bit disquieting?”

Yeah, I’m unsettled too. I think most people should. Income inequality (by most metrics I’m aware of) has been rising for the past fifty years or so.

There’s an argument that increasingly industrialized markets will tend to have higher levels of income inequality as smaller pools of more skilled individuals take on the workloads that used to occupy many. Since technology amplifies the abilities of individuals, natural variation in our activities due to hard work, family background, dumb luck, etc, are amplified as well, resulting in more and more disparate incomes.

I’m not sure I buy this argument–my naive, unconsidered objection might start by noting that many heavily industrialized societies like Japan and Germany have much lower income and wealth inequalities than ours.

Regardless of whether there’s a causal link between advancing technology and income inequality, the combination of the two suggests an obvious policy. We could decide that as our collective powers increase, we can afford as a society to provide increasing levels of basic needs to every person: free housing, transport, food, healthcare, and education, financed by the generosity of the rich and by a large-scale welfare state. Even highly progressive tax curves retain some financial incentive for work: look at the US from 1914 to 1984.

Aphyr
edc

I’m assuming your gun ownership data is the 2005 data available on wikipedia. Is the GINI data IMF or worldbank from 2005? Incidentally, the wiki data does have min max and average. No substitute for 5 summary of course but still.

Surprise123
Surprise123 on

I’m sure not a statistician, but reviewing your graphs makes me want to become one.

Oh, course, it would be great if all the stats represented here were more accurate, but, you work with what you’ve got, and vote for politicians who are interested in acquiring accurate data.

Other factors for study (if stats were available):

Homicide rates per 100 K verses % population that has been historically enslaved, or seriously oppressed (land taken away, insecure property rights, extra-judicial killings, etc.) by current polity within the past, say, 100, 300, and 500 years).

Homicide rates per 100 K versus % male population between the years of 13 and 25 without engaged law-abiding father figures in their lives (no engaged working fathers, no engaged coaches, no engaged clergy, no engaged mentors, no nothing).

Homicide rates per 100 K versus % population that has access to television, movies, and media that depict other people in their society with far more resources, material goods, and opportunities (not just wealth inequality, but widespread perception of wealth inequality).

Surprise123
Surprise123 on

Do you know of any surveys conducted by the most prominent pollsters on # of households with guns in them? Of, course, criminals, and people afraid of their household being identified as one associated with gun ownership, would not respond. But, it still might provide interesting data.

I read that 40% of all American households had guns in them. I wonder where that stat came from?

anonymous on

In one sense you don’t need to worry about whether GINI is a good measure of inequality or not. What we know is GINI correlates with homicide rate. Thus, lower your GINI and you’ll lower your homicide rate.

Leslie landberg
Leslie landberg on

It’s refreshing to know that the USA is still #1! Number one in homicides, number one in western infant mortality rates, number one in the first world in illiteracy and income disparity and poverty!! Go Team America! And when you feel that good about yourself, naturally you want to celebrate by going put and killing somebody with your precious guns. Beatles said it best: happiness is a warm gun.

On another note, the problems with your basic premise and sources seems insurmountable, but A for effort, and, no, I am not being sarcastic. It’s a great start, let’s keep going! I just know there is a pony under this mountain of confounding statistical shit, but we’ll have to continue to wrk together to unearth it.

Aaron Huisenfeldt
Aaron Huisenfeldt on

Uhhh yeah. Soooooo, when comparing based on income, poverty stricken countries have higher rates of all violent crimes. It is not an apples to apples comparison. You can’t compare because there is no comparison. Poverty stricken contras don’t have the infrastructure in government to attempt to stop crime, and oddly and sadly enough, the US is mixed right in the middle of third world countries on homicide rates gun ownership rate, which is beyond embarrassing and tragic.

Post a Comment

Comments are moderated. Links have nofollow. Seriously, spammers, give it a rest.

Please avoid writing anything here unless you're a computer. This is also a trap:

Supports Github-flavored Markdown, including [links](http://foo.com/), *emphasis*, _underline_, `code`, and > blockquotes. Use ```clj on its own line to start an (e.g.) Clojure code block, and ``` to end the block.