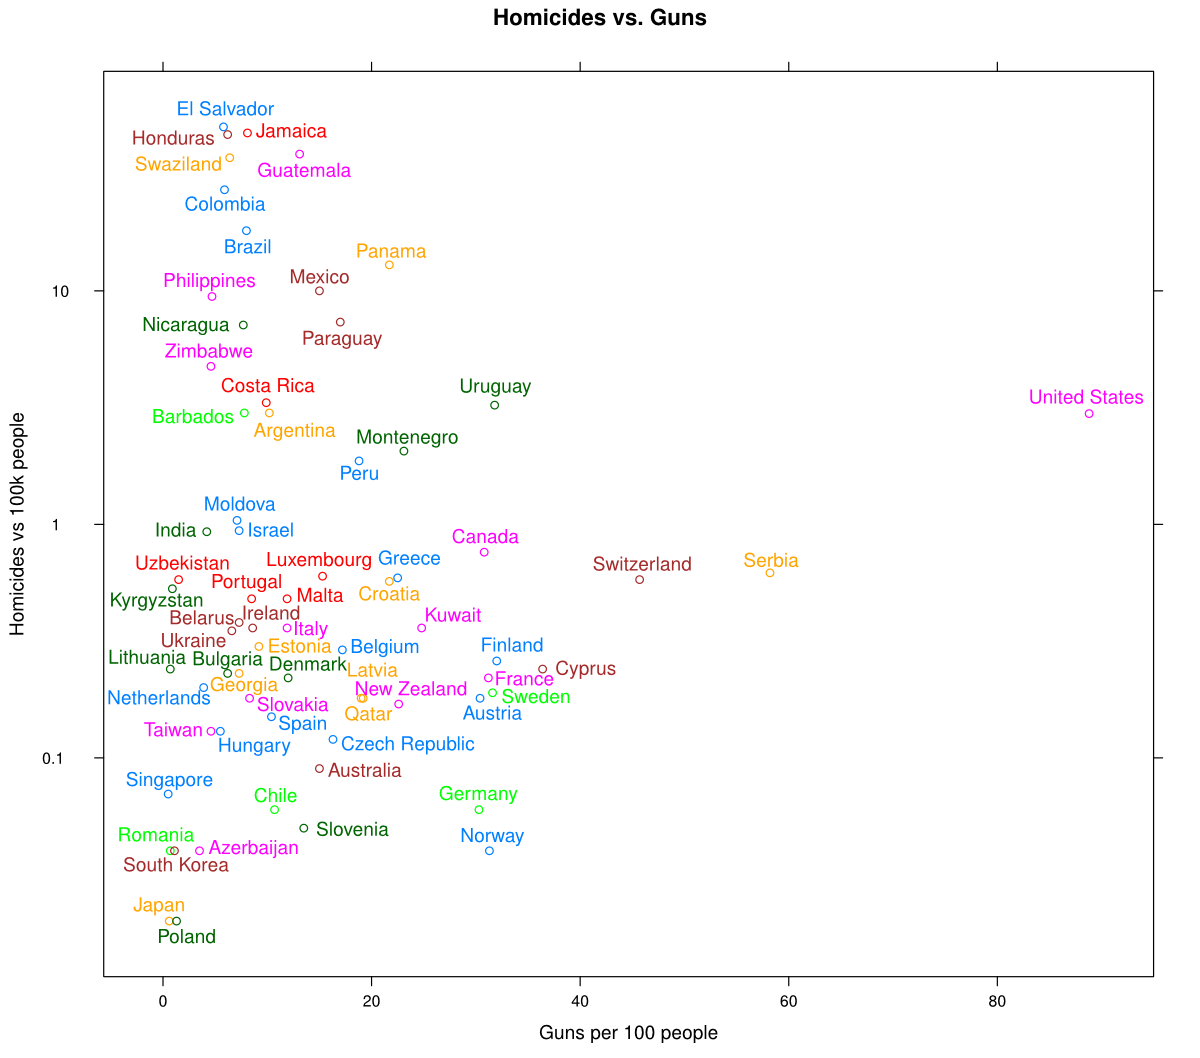
Firearm homicides vs gun prevalence
Inspired by Mark Reid’s post illustrating the bimodal relationship between the density of guns in a population and the number of gun homicides, I’ve created a slightly different plot from the same data, designed to illustrate a slightly… muddier relationship. This is an expanded variant of homicides vs guns, all countries, but scaling firearm homicides by log(10) shows the relationships between low-homicide countries.
library(directlabels)
library(lattice)

guns <- read.table("guns/data/guns.csv", sep="\t", header=TRUE)
deaths <- read.table("guns/data/deaths.csv", sep="\t", header=TRUE)
oecd <- read.table("guns/data/oecd.csv", sep="\t", header=TRUE)

data <- merge(guns, deaths, by="Country")
data$OECD <- data$Country %in% oecd$Country

plot(
  direct.label(
    xyplot(Homicides ~ Guns, data,
           group=Country,
           main="Homicides vs. Guns",
           xlab="Guns per 100 people",
           ylab="Homicides vs 100k people",
           scales=list(y = list(log = 10))),
    "top.points"))
